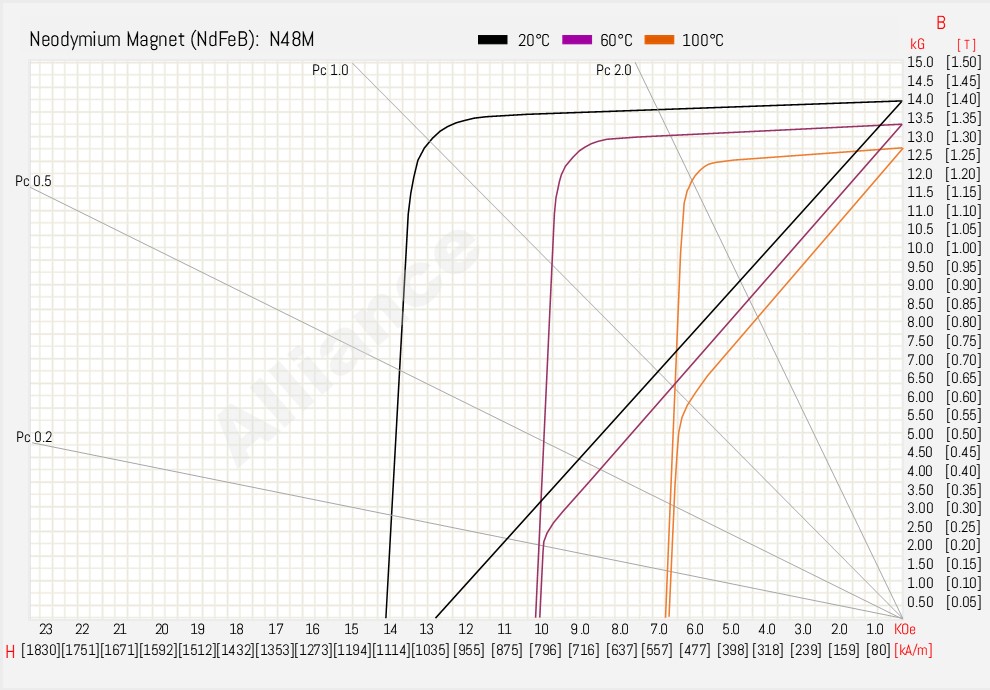
N48M Neodymium Magnet BH Curve
N48M magnet material has a maximum continuous working temperature of around 100°C (212°F), making it suitable for applications within this temperature range. N48M Neodymium magnet maximum energy product is approximately 48 MGOe (Mega Gauss Oersteds).
Understanding the BH Curve
Hysteresis curves, also called B-H curves, describe the properties of a magnetic material. The Hysteresis curve is plotted in a graph showing Magnetic Flux Density (B) and (H) Magnetic Field Strength. This test can be performed at elevated temperatures to show the decrease in magnetic properties.
To create the BH Curve, a magnetic sample, typically a small cube, is wound and placed between two large pole pieces of a DC Magnetizer. This creates a closed loop system. The DC magnetizer is then used to cycle the sample from origin to full saturation and then to complete demagnetization. The sample is then saturated in the opposite direction, and finally back to the original saturation level. A Fluxmeter and software continuously record B and H measurements to create the B-H Curve.
For a detailed explanation, download our PDF:

